
Updated November 2026. Refreshed monthly.
Lenders reporting under HMDA made 624,867 mortgages on investment properties in 2025, worth $464.6 billion (HMDA data, Jun 2026).
A DSCR loan is one way investors finance those doors. DSCR stands for debt service coverage ratio: the property's rent measured against its loan payment. The loan qualifies on the rent the property collects, so leases or a rent roll take the place of pay stubs and W-2s.
Public data on DSCR loans is thin, and most numbers online come from lenders selling them. So every figure below comes from the group that produced it: the Census Bureau, the federal mortgage data that lenders file each year, the Federal Reserve, the IRS, Fannie Mae, Freddie Mac and the rating agency KBRA. Where the public record runs out, we stop.
Key Takeaways
- Investment-property loans were 19.3% of all mortgage dollars lent in 2025 and 9.2% of all loans (HMDA data, Jun 2026).
- Lenders reported 404,217 business-purpose loans on 1 to 4 unit investment properties in 2025, worth $145.4 billion (HMDA data, Jun 2026).
- Among rentals with a mortgage, the median 2 to 4 unit building had a debt service coverage ratio of 74, plus or minus 14, on Census's scale where 100 means rent covers the payment exactly (Census Bureau and HUD, Feb 2026).
- 7.6% of U.S. rental homes stood empty in the third quarter of 2026, up from 7.1% a year earlier (Census Bureau, Oct 2026).
- Investors made 27% of U.S. single-family home purchases from March to June 2026, counting buyers who own three or more properties (Cotality, Sep 2026).
- Individual investors own 58.9% of U.S. rental properties but only about 32% of rental units (Census RHFS microdata, Feb 2026).
- 8,914,988 tax returns reported rent received on Schedule E for tax year 2023, a count that also covers commercial rentals (IRS, Jun 2026).
- 13.8% of U.S. families owned residential property beyond their own home in 2025, a count that includes second homes and time shares (Federal Reserve, Oct 2026).
- Rent of primary residence rose 2.8% in the year to September 2026 (BLS, Oct 2026).
- KBRA estimates private-label mortgage bond issuance hit a post-crisis record of $220 billion in 2026, up 35% from 2025 (KBRA, Nov 2026).
- DSCR purchase loans in KBRA-rated bond deals have defaults clustered near 2% (KBRA, Oct 2025).
- The average 30-year fixed mortgage rate is 7.28%, up from 6.26% a year ago (Freddie Mac, Nov 2026).
How Big Is the U.S. Rental Market?
The rental market is large, and it has more room in it than it did a few years ago. Vacancy has climbed steadily since 2022, which makes the rent a property can collect the number every investor should check first.
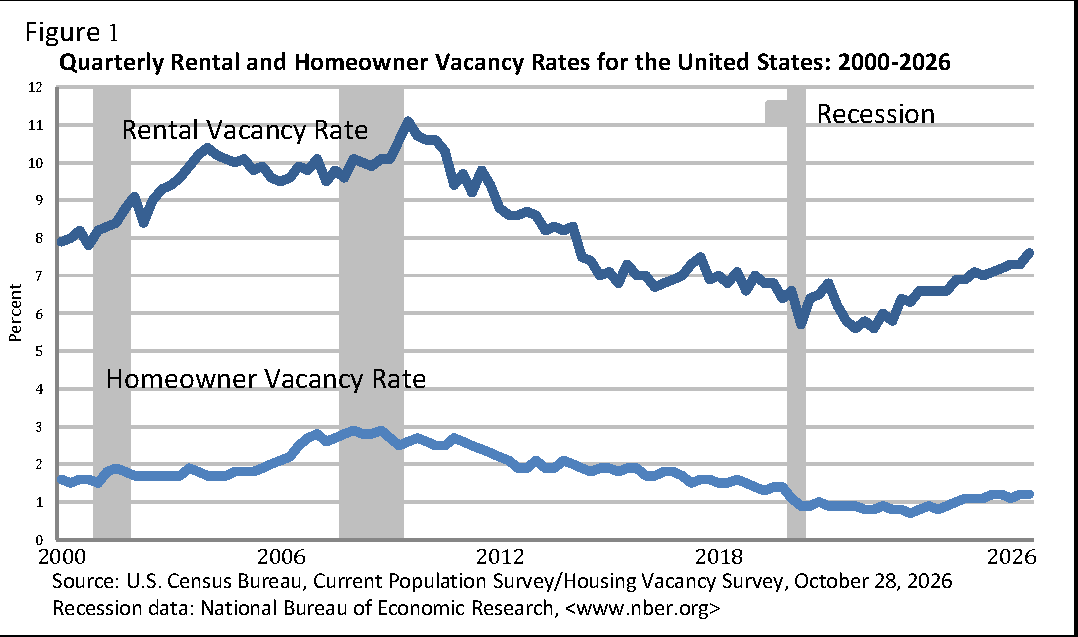
Figure 1: The rental vacancy rate (top line) has climbed for about four years, from under 6% in 2022 to 7.6%, so finding and keeping tenants matters more than it did then. The lower line is the vacancy rate for homes for sale. Source: U.S. Census Bureau, Quarterly Residential Vacancies, Third Quarter 2026, Oct 2026. Chart published by the source, captured 20 Nov 2026.
How many households rent?
About 46 million, close to a third of all homes in the country.
- 46,251,000 U.S. households rented their home in the third quarter of 2026, which is 30.9% of all housing units (Census Bureau, Oct 2026).
- The country had 49,722,000 rental units in 18,965,000 rental properties (Census Bureau and HUD, Feb 2026).
How many rentals sit empty?
Close to four million units were vacant and for rent, and the rate is higher in cities than in suburbs.
- 3,866,000 units were vacant and for rent in the third quarter of 2026, up from 3,549,000 a year earlier (Census Bureau, Oct 2026).
- The rental vacancy rate was 7.3% one quarter earlier, in the second quarter of 2026 (Census Bureau, Oct 2026).
- Rental vacancy was 8.8% in principal cities against 6.5% in suburbs (Census Bureau, Oct 2026).
- The South had the highest rental vacancy of any region, 9.2%, and the Northeast the lowest, 6.2% (Census Bureau, Oct 2026).
What does a vacant rental ask in rent?
About $1,500 a month at the middle of the market.
- The median asking rent for vacant units for rent was $1,541 in the third quarter of 2026 (Census Bureau, Oct 2026).
Who Owns America's Rental Properties?
Most rental properties belong to individual people. Companies hold the big buildings, while individual owners hold the single homes and small multi-unit buildings that make up most of the count.
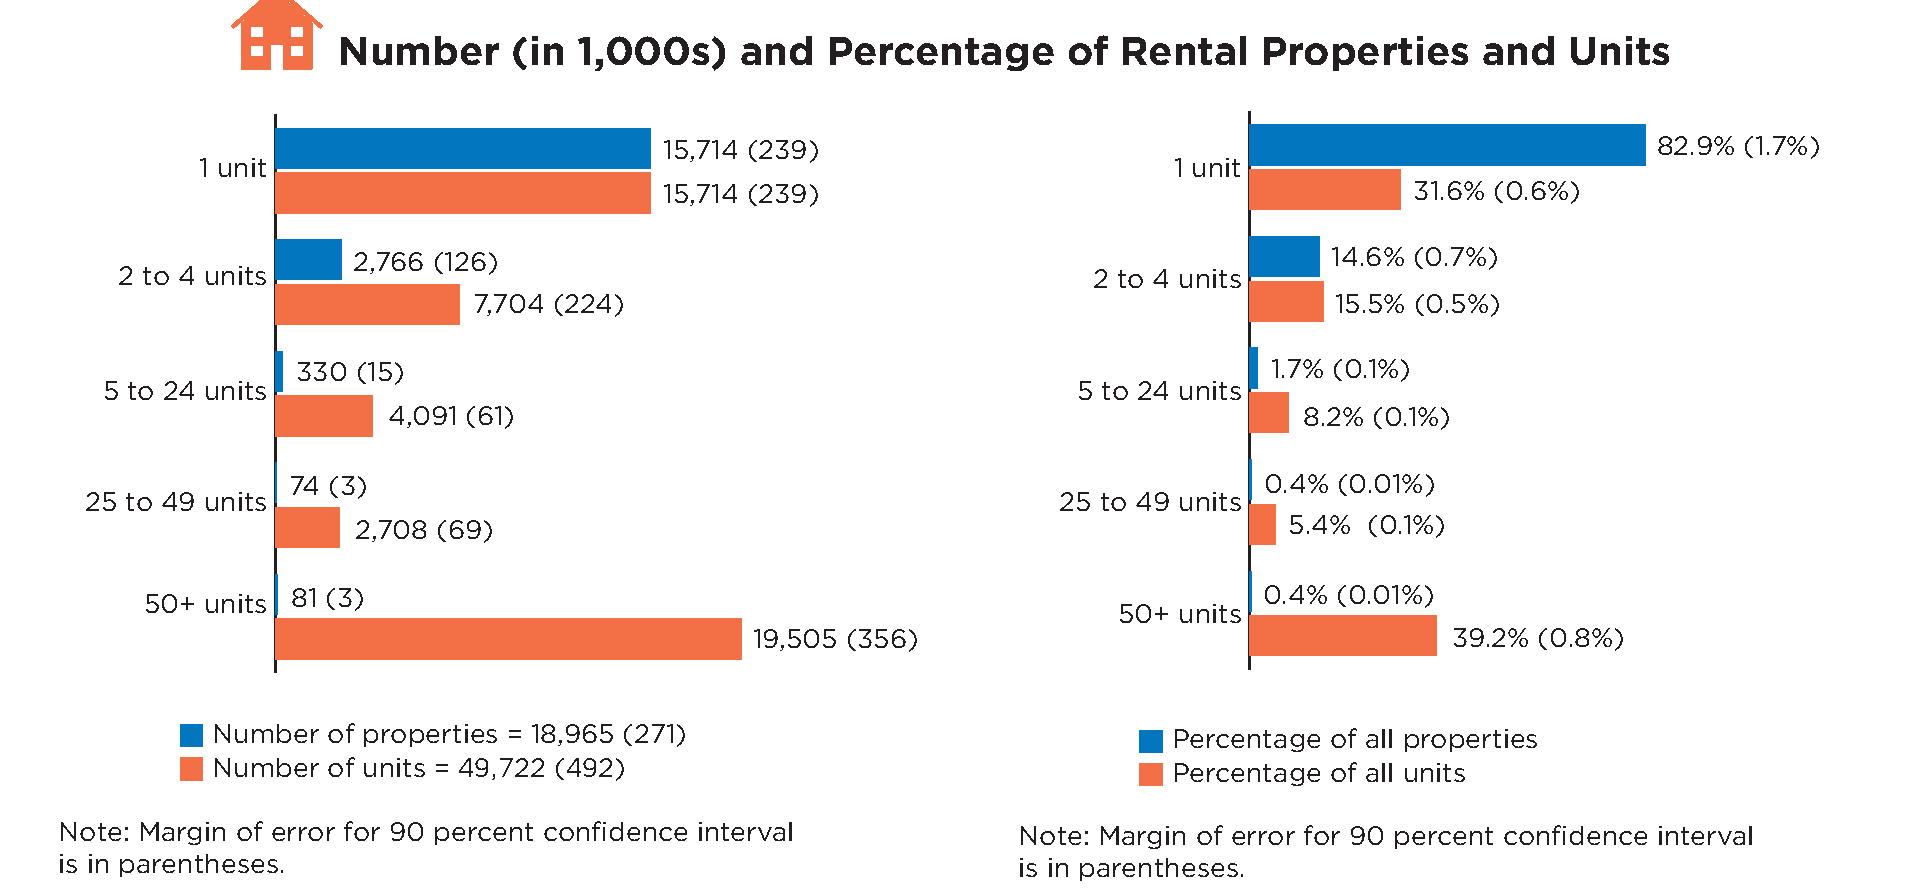
Figure 2: Single homes are more than four in five rental properties but under a third of rental units, so the typical rental owner holds a house or a small building. Source: U.S. Census Bureau and HUD, 2024 Rental Housing Finance Survey, Feb 2026. Screenshot of the source page, captured 20 Nov 2026.
How many rental properties are single homes?
More than four in five.
- 82.9% of U.S. rental properties are single-unit properties, and they hold 31.6% of rental units (Census Bureau and HUD, Feb 2026).
- 2,766,000 rental properties have 2 to 4 units, holding 7,704,000 units between them (Census Bureau and HUD, Feb 2026).
Who owns them?
Individuals own most properties, while companies own most units.
- Partnerships and limited liability companies own 21.4% of rental properties and about 43% of rental units (Census RHFS microdata, Feb 2026).
- Among rental properties with 1 to 4 units, 59.9% are owned by individual investors (Census RHFS microdata, Feb 2026).
- 48.7% of individual owners of 1 to 4 unit rentals also own other properties (Census RHFS microdata, Feb 2026).
- 33.9% of 1 to 4 unit rental properties carry a mortgage or similar debt, and 8.6% did not report (Census RHFS microdata, Feb 2026).
How many families own a rental or second property?
Roughly one family in seven, counting second homes and time shares.
- The median value of residential property families own beyond their main home, which includes second homes and time shares, was $280,000 in 2025, up 14% from 2022 (Federal Reserve, Oct 2026).
- 4.4% of families carried debt secured by residential property other than their main home, including second homes, with a median balance of $148,600 (Federal Reserve, Oct 2026).
How many people report rental income to the IRS?
Close to nine million tax returns, and about half of them pay mortgage interest on the property.
- Schedule E filers reported $436.66 billion of rents received in tax year 2023, a total that also covers commercial rentals (IRS, Jun 2026).
- 4,450,123 returns deducted mortgage interest on rental property, totaling $62.52 billion (IRS, Jun 2026).
- 3,925,866 returns reported a deductible rental real estate loss (IRS, Jun 2026).
How Much Are Investors Buying and Building?
Investors are still a big slice of the buyers. The pullback this year came from the largest firms, while owners of a handful of doors kept buying.
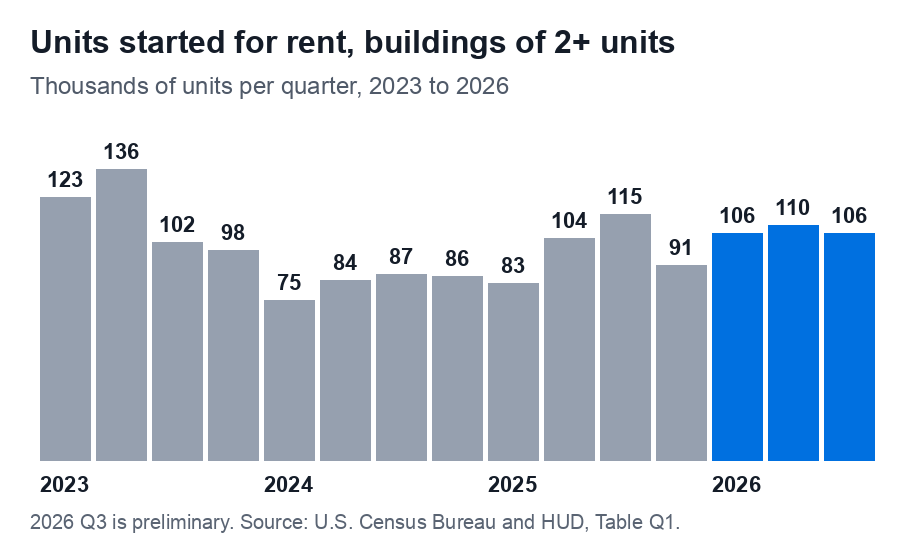
Figure 3: Rental construction bottomed out in early 2024 and has topped 100,000 units in five of the last six quarters, which adds supply in the same years vacancy has been rising. Source: U.S. Census Bureau and HUD, Quarterly Starts and Completions by Purpose and Design, Table Q1, Nov 2026. Chart drawn by GoodLoan from the source's data, 20 Nov 2026.
What share of home purchases go to investors?
A bit more than a quarter of single-family purchases, using Cotality's count of buyers who own three or more properties.
- The investor share was 28% at the close of the first quarter of 2026, under the same definition (Cotality, Sep 2026).
- Investors bought about 273,000 homes in the second quarter of 2026, roughly 40,000 fewer than a year earlier (Cotality, Sep 2026).
Are small investors pulling back?
Barely. The drop came from the largest buyers.
- Investors who own 3 to 9 properties cut their purchase volume by 3% from a year earlier (Cotality, Sep 2026).
- Investors with 1,000 or more properties averaged about 4,500 purchases a month in the first quarter of 2026, 40% fewer than a year earlier (Cotality, Sep 2026).
- Investors with 100 to 999 properties bought 21% fewer homes, and those with 10 to 99 properties bought 17% fewer (Cotality, Sep 2026).
How many homes are being built to rent?
Hundreds of thousands of units a year, almost all in larger buildings.
- Builders started 392,000 units for rent in buildings of two or more units in 2025, up from 331,000 in 2024 (Census construction data, Nov 2026).
- Rental starts in the first three quarters of 2026 came to 322,000 units, 6.6% more than the 302,000 in the same months of 2025 (Census construction data, Nov 2026).
- Only 19,000 of the units started in buildings of two or more units in 2025 were in 2 to 4 unit buildings (Census construction data, Nov 2026).
Do Rental Properties Cover Their Mortgage Payments?
Census measures this directly for rentals with a mortgage, and it calls the measure the debt service coverage ratio. In plain words, it takes the rent left after running costs and compares it with the mortgage payment, so 100 means the two are equal. For 2 to 4 unit buildings the median sits clearly under that line, while for single homes the margin of error is too wide to tell.
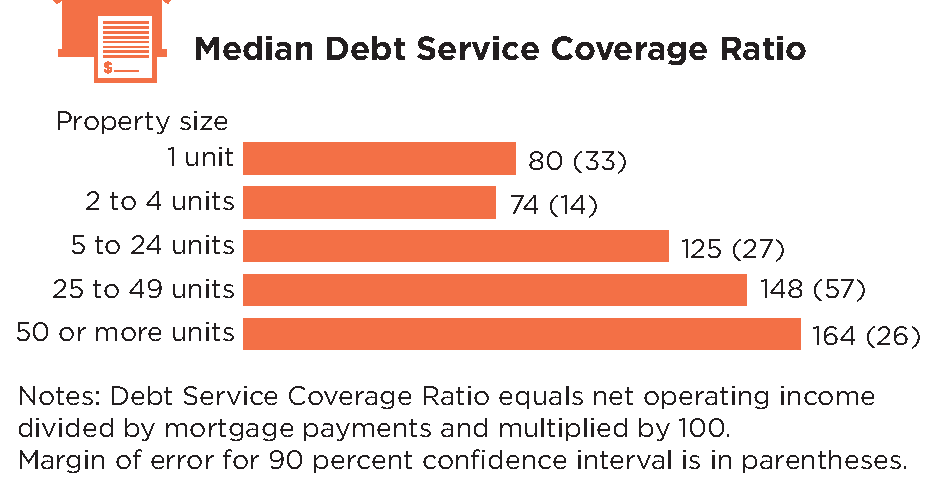
Figure 4: Among rentals with a mortgage, the median 2 to 4 unit building brings in less after running costs than its mortgage payment, while buildings of 50 or more units cover theirs more than one and a half times. The margin in brackets is wide for single homes, so their figure could sit on either side of 100. Source: U.S. Census Bureau and HUD, 2024 Rental Housing Finance Survey, Feb 2026. Screenshot of the source page, captured 20 Nov 2026.
What is the typical debt service coverage ratio on a rental?
On Census's scale, 80 for single homes and 74 for 2 to 4 unit buildings. Only the 2 to 4 unit figure is clearly below 100 once the margin of error is counted.
- The median debt service coverage ratio for one-unit rentals was 80, with a margin of error of plus or minus 33, so the true figure could sit above 100 (Census Bureau and HUD, Feb 2026).
- Properties with 50 or more units had a median of 164, plus or minus 26, and 5 to 24 unit buildings had 125, plus or minus 27 (Census Bureau and HUD, Feb 2026).
What does it cost to run a rental unit?
Several thousand dollars a unit each year, and single homes cost the most per unit among small rentals.
- Operating costs averaged $8,670 per unit in 2023 for one-unit rentals and $5,820 per unit for 2 to 4 unit rentals (Census Bureau and HUD, Feb 2026).
- Mean original debt on one-unit rentals was $178,000, and mean debt still owed was $146,000 (Census Bureau and HUD, Feb 2026).
- One-unit rentals were bought for $180,000 on average and are now worth $413,000 on average (Census Bureau and HUD, Feb 2026).
How fast are rents rising?
Slower than housing costs overall.
- The broader shelter index rose 3.2% in the year to September 2026 (BLS, Oct 2026).
If you want to see how your own rent measures against a new loan payment, we run those numbers at dscr.goodloan.ai. Call, text or chat (866) 599-0088, 8am to 8pm Eastern.
How Much Mortgage Lending Goes to Investment Properties?
Investor lending is a bigger share of the money than of the loan count, because investor loans include large apartment buildings. On the 1 to 4 unit homes most investors own, most of the lending is done as business-purpose loans.
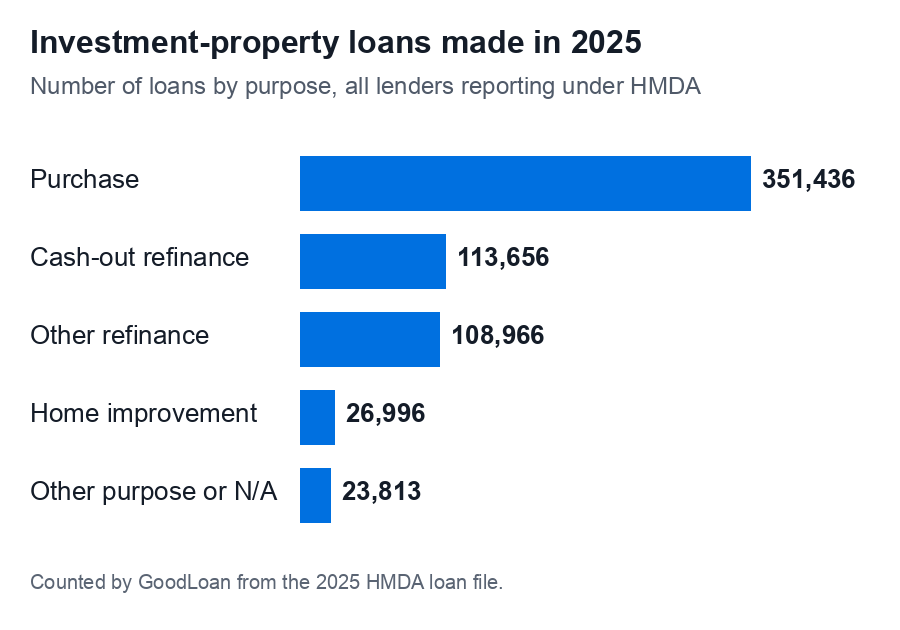
Figure 5: Purchases are more than half of investment-property lending, and cash-out refinances edge out ordinary refinances, which shows owners using equity in their portfolio. Source: FFIEC and CFPB, 2025 HMDA Snapshot National Loan-Level Dataset, Jun 2026. Chart drawn by GoodLoan from the source's data, 20 Nov 2026.
How many investment-property loans are made each year?
More than 600,000 a year, most of them to buy a property.
- 351,436 of the 2025 investment-property loans were purchases, 56.2% of the total (HMDA data, Jun 2026).
- 113,656 were cash-out refinances and 108,966 were other refinances (HMDA data, Jun 2026).
- 574,133 loans went to 1 to 4 unit site-built investment homes, averaging about $339,000 each (HMDA data, Jun 2026).
- 41,328 loans on investment apartment buildings of five or more units totaled $263.6 billion (HMDA data, Jun 2026).
- 99.4% of investment-property loans were conventional loans rather than FHA, VA or USDA loans (HMDA data, Jun 2026).
How many are business-purpose loans?
About seven in ten loans on 1 to 4 unit investment homes. HMDA has no DSCR flag, so business-purpose loans on 1 to 4 unit investment properties reported under HMDA are the closest public measure.
- Business-purpose loans were 70.4% of 2025 loans on 1 to 4 unit site-built investment properties (HMDA data, Jun 2026).
- 227,016 of those business-purpose loans were purchases and 84,857 were cash-out refinances (HMDA data, Jun 2026).
- 53.1% of those business-purpose loans reported no borrower income, which fits loans qualified on the property's rent or made to a company (HMDA data, Jun 2026).
- The median business-purpose first-lien purchase loan was $245,000 at a combined loan-to-value of 75 (HMDA data, Jun 2026).
- The median business-purpose cash-out refinance was $225,000 at a combined loan-to-value of 70 (HMDA data, Jun 2026).
Do investors pay a higher rate?
Yes, and business-purpose loans carry a little more again.
- The median rate on 2025 first-lien conventional purchase loans for 1 to 4 unit homes was 7.25% for investment properties against 6.50% for primary homes (HMDA data, Jun 2026).
- On first-lien 1 to 4 unit investment purchases, the median rate was 7.375% for business-purpose loans and 6.99% for other investment loans (HMDA data, Jun 2026).
How much of Fannie Mae and Freddie Mac's business is investor loans?
A small slice. These are agency loans, which are separate from DSCR loans.
- Investor loans were 3% of Fannie Mae's single-family acquisitions in the third quarter of 2026, down from 4% a year earlier, and 5% of its book (Fannie Mae, Oct 2026).
- Investment properties were 4% of Freddie Mac's 2025 single-family purchases, down from 6% in 2023 (Freddie Mac, Feb 2026).
- Investment properties were 5% of Freddie Mac's single-family mortgage portfolio at the end of 2025 (Freddie Mac, Feb 2026).
If you own rentals and want a plan built on the rent each door collects, we build that at dscr.goodloan.ai. Call, text or chat (866) 599-0088, 8am to 8pm Eastern.
How Big Is the DSCR and Non-QM Bond Market, and How Do the Loans Perform?
DSCR loans are sold into private mortgage bonds, and the rating agencies that grade those bonds publish the clearest public numbers on them. Those numbers show a market at record size, with loans that have defaulted at low rates and lost very little.
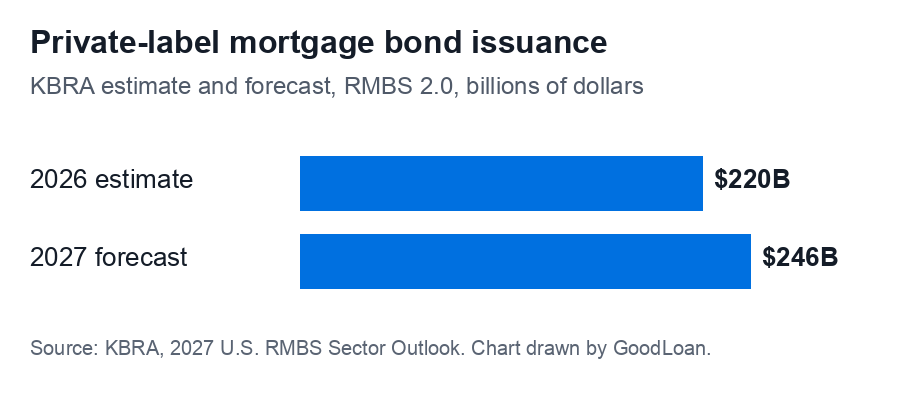
Figure 6: Private mortgage bond issuance is on course for a record and KBRA expects more in 2027, with non-QM loans, the group that holds DSCR loans, as the largest part. Source: KBRA, 2027 U.S. RMBS Sector Outlook, Nov 2026. Chart drawn by GoodLoan from the source's data, 20 Nov 2026.
How much non-QM debt is securitized?
Tens of billions of dollars a year, inside a private bond market KBRA sees passing $200 billion.
- KBRA forecasts private-label issuance will rise another 12% to $246 billion in 2027 (KBRA, Nov 2026).
- KBRA expects non-prime issuance, which includes non-QM, to grow 13.6% and prime to grow 12.7% (KBRA, Nov 2026).
- Non-QM bond issuance reached $33 billion in 2025 by the end of August (KBRA, Oct 2025).
- Redwood Trust's non-QM unit, whose loans are mainly bank statement and DSCR loans, completed five securitizations of $2.2 billion of loans in 2026 through September 30 (Redwood Trust, Nov 2026).
What does a DSCR-only bond deal look like?
A few hundred million dollars of 30-year fixed loans on rental homes.
- GS Mortgage-Backed Securities Trust 2026-DSC1 was a $301.8 million deal backed only by loans underwritten to DSCR guidelines (KBRA, Feb 2026).
- The pool held 1,331 rental property mortgages, an average of about $226,700 each (KBRA, Feb 2026).
- 98.3% of the pool was 30-year loans, and every loan was exempt from the federal ability-to-repay rule because it was made for business purposes (KBRA, Feb 2026).
- United Wholesale Mortgage was the largest originator in the pool, at 24.7% (KBRA, Feb 2026).
How do DSCR and non-QM loans perform?
Defaults are low, and losses on securitized non-QM loans have been close to zero.
- The cumulative default rate across all KBRA-rated non-QM loans stood at 3.2% (KBRA, Oct 2025).
- Historical losses have stayed below 0.05% across securitized non-QM loans (KBRA, Oct 2025).
- Leaving out the 2020 pandemic spike, yearly non-QM default rates have generally stayed below 2% (KBRA, Oct 2025).
- 82.2% of DSCR purchase loans had no lease in place at closing, because many buy a vacant property to rent out; 61.7% of DSCR refinances had one (KBRA, Oct 2025).
- Through October 31, 2026, 99.99% of KBRA's U.S. residential bond rating reviews were affirmations or upgrades (KBRA, Nov 2026).
- For context, 4.37% of all 1 to 4 unit mortgages were behind on payments in the second quarter of 2026 (MBA, Aug 2026).
Glossary
- DSCR (debt service coverage ratio): the property's rent measured against its loan payment. A DSCR loan qualifies on that rent instead of pay stubs. Census writes it on a scale where 100 means the two are equal.
- Net operating income: rent collected minus the costs of running the property, before the mortgage payment.
- Non-QM: a mortgage made outside the federal qualified mortgage rules, such as a DSCR or bank statement loan.
- Business-purpose loan: a loan made for a business reason, such as financing a rental, rather than for personal or household use.
- HMDA: the Home Mortgage Disclosure Act, under which lenders report every mortgage application to federal regulators each year.
- RMBS: residential mortgage-backed securities, bonds paid from a pool of home loans. "Private-label" means not issued through Fannie Mae, Freddie Mac or Ginnie Mae.
- Combined loan-to-value: all loans on a property as a percentage of its value.
- Rental vacancy rate: the share of the rental stock that is empty and for rent.
- Lease in place: a signed lease on the property when the loan closes.
- Securitization: pooling loans and selling bonds backed by them.
Methodology and Sources
Every statistic on this page was read on the page or file of the group that produced it, in November 2026. We do not cite lender blogs, statistics roundups or news summaries, and that rules out most DSCR market figures online. HMDA has no DSCR field, so we counted 2025 originations ourselves from the national loan file: investment properties are occupancy type 3, and the counts take every origination, including open-end lines of credit and second liens. Business-purpose loans on 1 to 4 unit investment properties reported under HMDA are the closest public measure of DSCR-type lending; HMDA does not count DSCR loans as such. Rental ownership and mortgage shares were computed from the Census 2024 Rental Housing Finance Survey public use file with its property weights. The property total matches the 18,965,000 properties Census publishes, and owner type was not reported for 8.2% of properties, which stay in the base. Census's own debt service coverage figures come with wide margins of error, which we print with them. Agency investor loans from Fannie Mae and Freddie Mac are separate from DSCR loans. The rent figure is the latest 12-month change BLS has published. This page is refreshed monthly as Census, the Federal Reserve, KBRA and the mortgage regulators publish new data.
Sources
- U.S. Census Bureau, Quarterly Residential Vacancies, Third Quarter 2026
- U.S. Census Bureau and HUD, 2024 Rental Housing Finance Survey infographic
- U.S. Census Bureau and HUD, 2024 Rental Housing Finance Survey public use file
- U.S. Census Bureau and HUD, Quarterly Starts and Completions by Purpose and Design
- FFIEC and CFPB, 2025 HMDA Snapshot National Loan-Level Dataset
- Federal Reserve Board, Changes in U.S. Family Finances from 2022 to 2025
- Internal Revenue Service, Publication 4801, Individual Income Tax Returns Line Item Estimates 2023
- Bureau of Labor Statistics, Consumer Price Index, September 2026
- Cotality, Institutional investors pull back ahead of new housing restrictions
- Fannie Mae, Form 10-Q for the quarter ended September 30, 2026
- Freddie Mac, 2025 Form 10-K
- Freddie Mac, Primary Mortgage Market Survey
- Redwood Trust, Form 10-Q for the quarter ended September 30, 2026
- KBRA, 2027 U.S. RMBS Sector Outlook
- KBRA, Non-QM RMBS Default Study: Credit Attribute Insights
- KBRA, Preliminary Ratings for GS Mortgage-Backed Securities Trust 2026-DSC1
- Mortgage Bankers Association, National Delinquency Survey, second quarter 2026


