
Updated November 2026. Refreshed monthly.
American owners are sitting on more home equity than at almost any point on record, and they have started to borrow against it again. Home equity line balances rose $23 billion in the third quarter of 2026 alone, the biggest jump since 2005 (New York Fed, Nov 2026).
The reason is not a mystery. Mortgage rates are above 7%, so most owners will not trade a low first mortgage for a new one. A second loan on the home lets them borrow against the equity and keep the mortgage they have.
Every number below links to the group that produced it: the Federal Reserve, the New York Fed, the FDIC, the FHFA, the NCUA, the mortgage disclosure data lenders file each year, and the research teams that ran each survey. No roundups, no copies of copies.
Key Takeaways
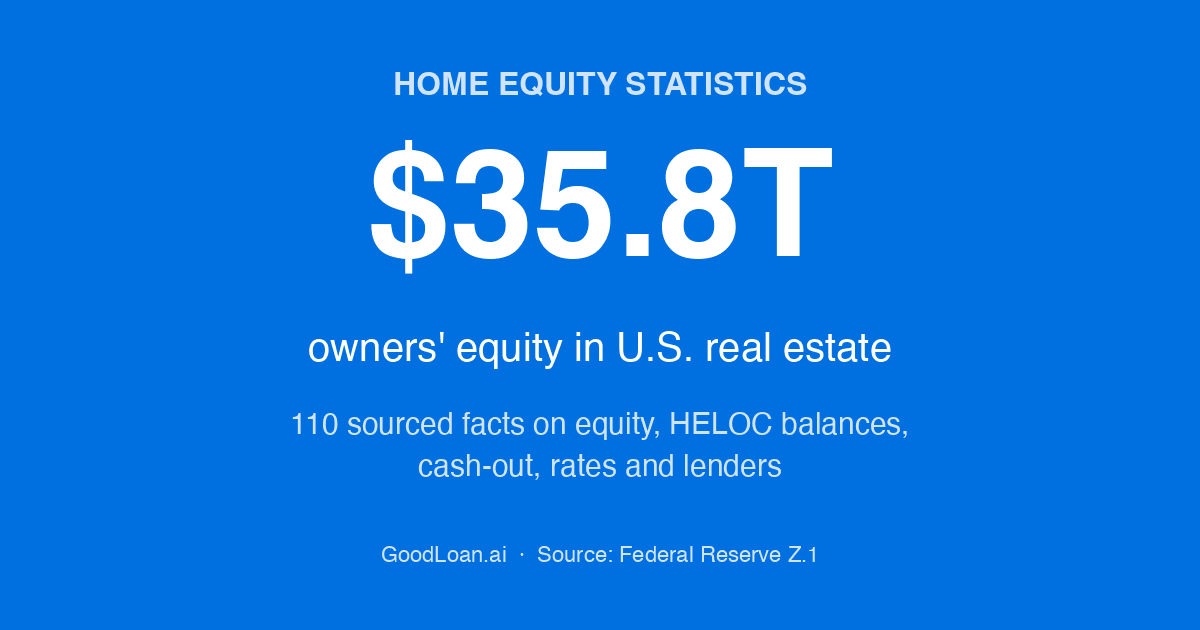
- Owners' equity in American real estate reached $35.8 trillion in mid-2026 (Federal Reserve Z.1, Sep 2026).
- 46.7 million mortgage holders have equity they could borrow against while keeping a 20% cushion (ICE Mortgage Monitor, Nov 2026).
- The typical homeowning family's home is worth $230,000 more than the debt against it (Federal Reserve SCF, Oct 2026).
- U.S. house prices rose 2.4% in the year to August 2026 (FHFA, Oct 2026).
- Home equity line of credit (HELOC) balances reached $481 billion after 18 straight quarterly increases (New York Fed, Nov 2026).
- Lenders made 1,558,203 second-lien loans in 2025, worth $179.3 billion, according to the loans reported under HMDA (HMDA Data Browser, Mar 2026).
- Cash-out refinances rose 23.9% in 2025, to 953,349 loans (HMDA Data Browser, Mar 2026).
- 39% of 2024 home equity borrowers said they were consolidating debt, up from 25% in 2022 (MBA, Aug 2025).
- The average credit card rate is 21.19% (Federal Reserve, Sep 2026).
- The average 30-year fixed mortgage rate is 7.28%, up from 6.26% a year ago (Freddie Mac, Nov 2026).
- Only 0.85% of HELOC balances were 90 or more days late in the third quarter of 2026, against 12.9% of credit card balances (New York Fed, Nov 2026).
- Bank of America holds the most home equity lines of any U.S. bank, $26.9 billion (FDIC, Jun 2026).
- Credit unions hold $187.8 billion in junior-lien home loans, up 13.4% in a year (NCUA, Jun 2026).
How Much Home Equity Do Americans Have?
More than at almost any time on record. Prices climbed fast after 2020, and the debt against homes grew much more slowly, so the gap between the two has become one of the biggest stores of household wealth.
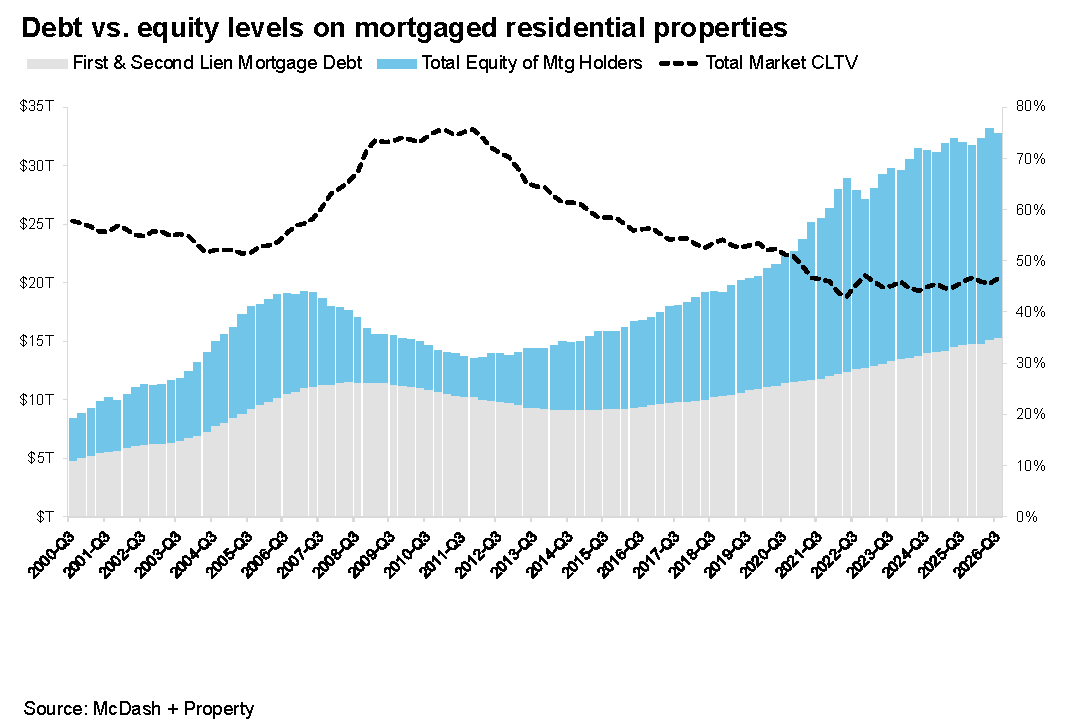
Figure 1: Equity on mortgaged homes has climbed far faster than the debt against them since 2019, so the share of home value that is borrowed sits well under its pre-2020 level. Source: ICE, Mortgage Monitor November 2026, Housing market and equity update, Nov 2026. Screenshot of the source report, captured 20 Nov 2026.
How much equity do homeowners hold in total?
Trillions more than they owe. Owners hold about seven dollars of every ten in home value as equity.
- Owners' equity was 71.9% of the value of household real estate in the second quarter of 2026 (Federal Reserve Z.1, Sep 2026).
- Owners' equity grew 2.2% from a year earlier, an increase of about $785 billion (Federal Reserve Z.1, Sep 2026).
- Owner-occupied real estate was worth $49.8 trillion (Federal Reserve Z.1 Recent Developments, Sep 2026).
- The value of household real estate rose $1.1 trillion in the second quarter of 2026 alone (Federal Reserve Z.1 Recent Developments, Sep 2026).
- Home mortgages owed by households came to $14.0 trillion (Federal Reserve Z.1 Recent Developments, Sep 2026).
- Mortgage balances on consumer credit reports totaled $13.4 trillion at the end of September 2026 (New York Fed, Nov 2026).
How much can mortgage holders borrow against?
A lot. Tappable equity is the part an owner can borrow while still leaving 20% of the home's value untouched.
- Mortgage holders held $17.5 trillion in equity in the third quarter of 2026, up 1.4% from a year earlier (ICE Mortgage Monitor, Nov 2026).
- The average borrower now has $204,000 in equity, up $16,600 from a year earlier (ICE Mortgage Monitor, Nov 2026).
- Tappable equity rose 1.2% from a year earlier, its fastest annual growth in five quarters (ICE Mortgage Monitor, Nov 2026).
- The number of borrowers with tappable equity fell 1.2% from a year earlier (ICE Mortgage Monitor, Nov 2026).
How much equity does a typical owner have?
Hundreds of thousands of dollars on average, and the typical figure is still rising.
- The mean family with a home had $380,400 more in home value than in debt against it (Federal Reserve SCF, Oct 2026).
- The median family's net housing value rose 5% between 2022 and 2025, from $218,900 (Federal Reserve SCF, Oct 2026).
- 66% of families owned their home in 2025, about the same as in 2022 (Federal Reserve SCF, Oct 2026).
How many homeowners have no mortgage at all?
A little over a third. The rest carry some debt against the home, and that debt is growing.
- About 42% of families held debt secured by their main home in 2025, which means almost two thirds of homeowners do (Federal Reserve SCF, Oct 2026).
- The median balance on that home-secured debt rose 8% to $183,600 between 2022 and 2025 (Federal Reserve SCF, Oct 2026).
- The mean balance on home-secured debt rose 3% to $239,700 (Federal Reserve SCF, Oct 2026).
How Much Are Home Values Rising?
Slowly, but still up. The years of double-digit gains are over, yet prices keep finishing each year higher than the last, and each small gain adds to the equity owners can borrow against.
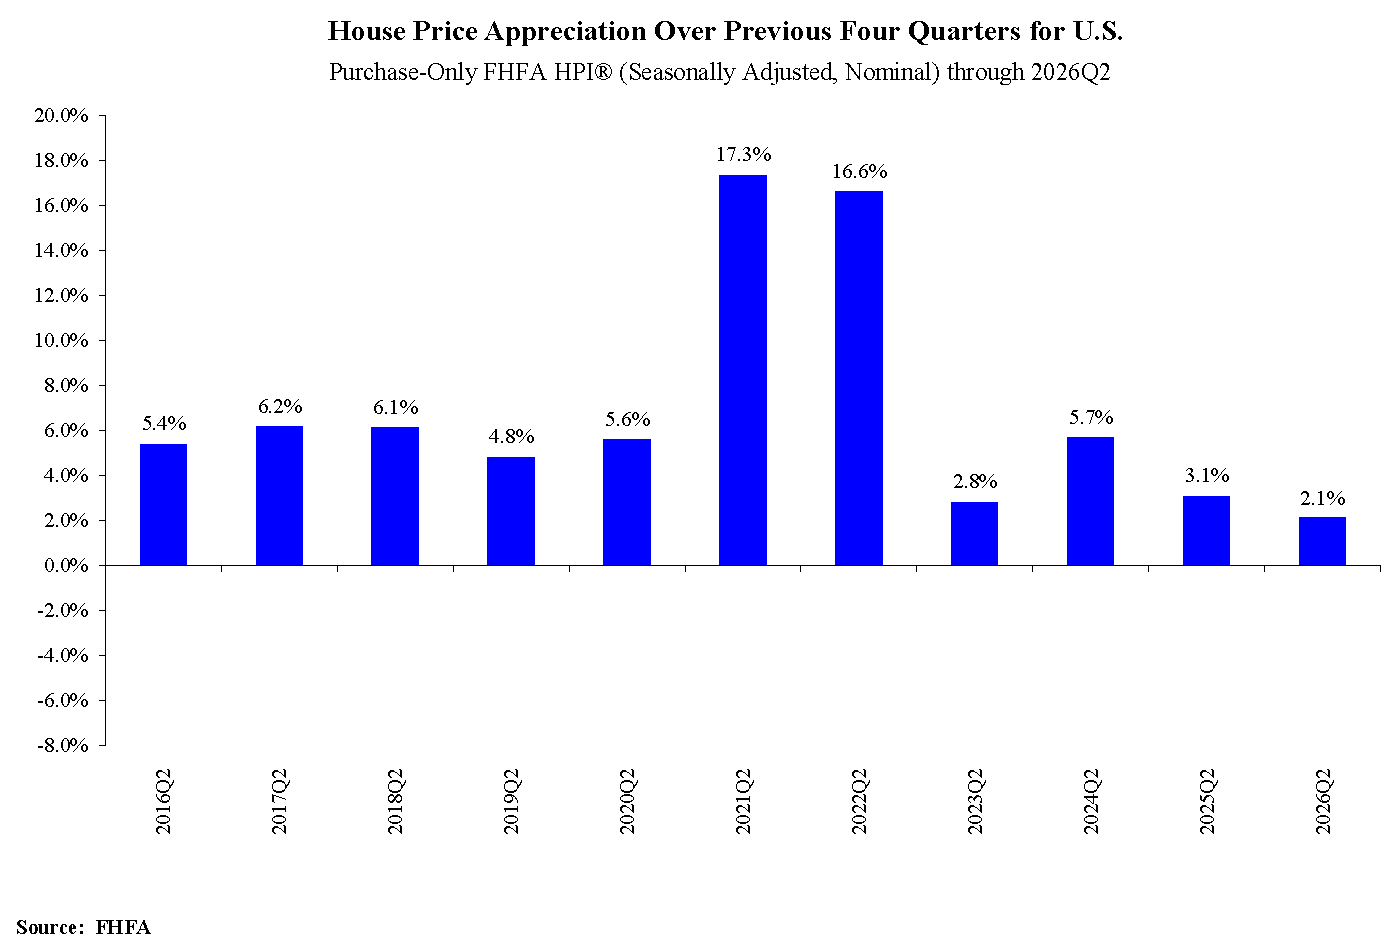
Figure 2: Price growth has cooled from gains of 16% to 17% in 2021 and 2022 to about 2% a year, but it has stayed positive, which keeps owners' equity edging up. Source: Federal Housing Finance Agency, House Price Index Quarterly Report 2026Q2, Aug 2026. Screenshot of the source report, captured 20 Nov 2026.
How much did home prices rise this year?
About 2%, after a much faster run earlier in the decade.
- House prices rose 0.3% in August 2026 from July (FHFA, Oct 2026).
- Prices rose 2.1% between the second quarter of 2025 and the second quarter of 2026 (FHFA HPI Report, Aug 2026).
- U.S. prices have risen on an annual basis in every quarter since the start of 2012 (FHFA HPI Report, Aug 2026).
- Over the five years to mid-2026, U.S. house prices rose 33.41% (FHFA HPI Report, Aug 2026).
- In the year to mid-2021, prices rose 17.3%, the largest gain in the ten years the report charts (FHFA HPI Report, Aug 2026).
Where are prices rising and falling?
Rising almost everywhere, led by the East North Central states, with a few states slipping.
- Prices rose in 46 states and the District of Columbia over the year to mid-2026 (FHFA HPI Report, Aug 2026).
- Alaska led with an 8.3% gain, and New Mexico had the largest drop, 1.2% (FHFA HPI Report, Aug 2026).
- Over the year to August 2026, regional gains ranged from 0.5% in the Mountain states to 4.4% in the East North Central states (FHFA, Oct 2026).
- California prices slipped 0.20% over the year to mid-2026, while Florida prices are still 37.47% above where they were five years earlier (FHFA HPI Report, Aug 2026).
- Prices rose in 76 of the 100 largest metro areas (FHFA HPI Report, Aug 2026).
- Texas prices rose 0.45% over the year to mid-2026 (FHFA HPI Report, Aug 2026).
How much debt sits against home values?
Less than half of what mortgaged homes are worth, well under the level before 2020.
- Debt on mortgaged homes was 46.6% of their value in the third quarter of 2026, against 53.4% in the third quarter of 2019 (ICE Mortgage Monitor, Nov 2026).
- Mortgaged homes were worth $32.8 trillion, up from $31.9 trillion a year earlier (ICE Mortgage Monitor, Nov 2026).
- First and second lien mortgage debt reached a record $15.3 trillion (ICE Mortgage Monitor, Nov 2026).
How Big Is the HELOC Market?
Smaller than it was in 2009, and now growing at its quickest pace in two decades. Home equity lines of credit (HELOCs) shrank for more than a decade, then turned around in 2022, and the climb has picked up speed.
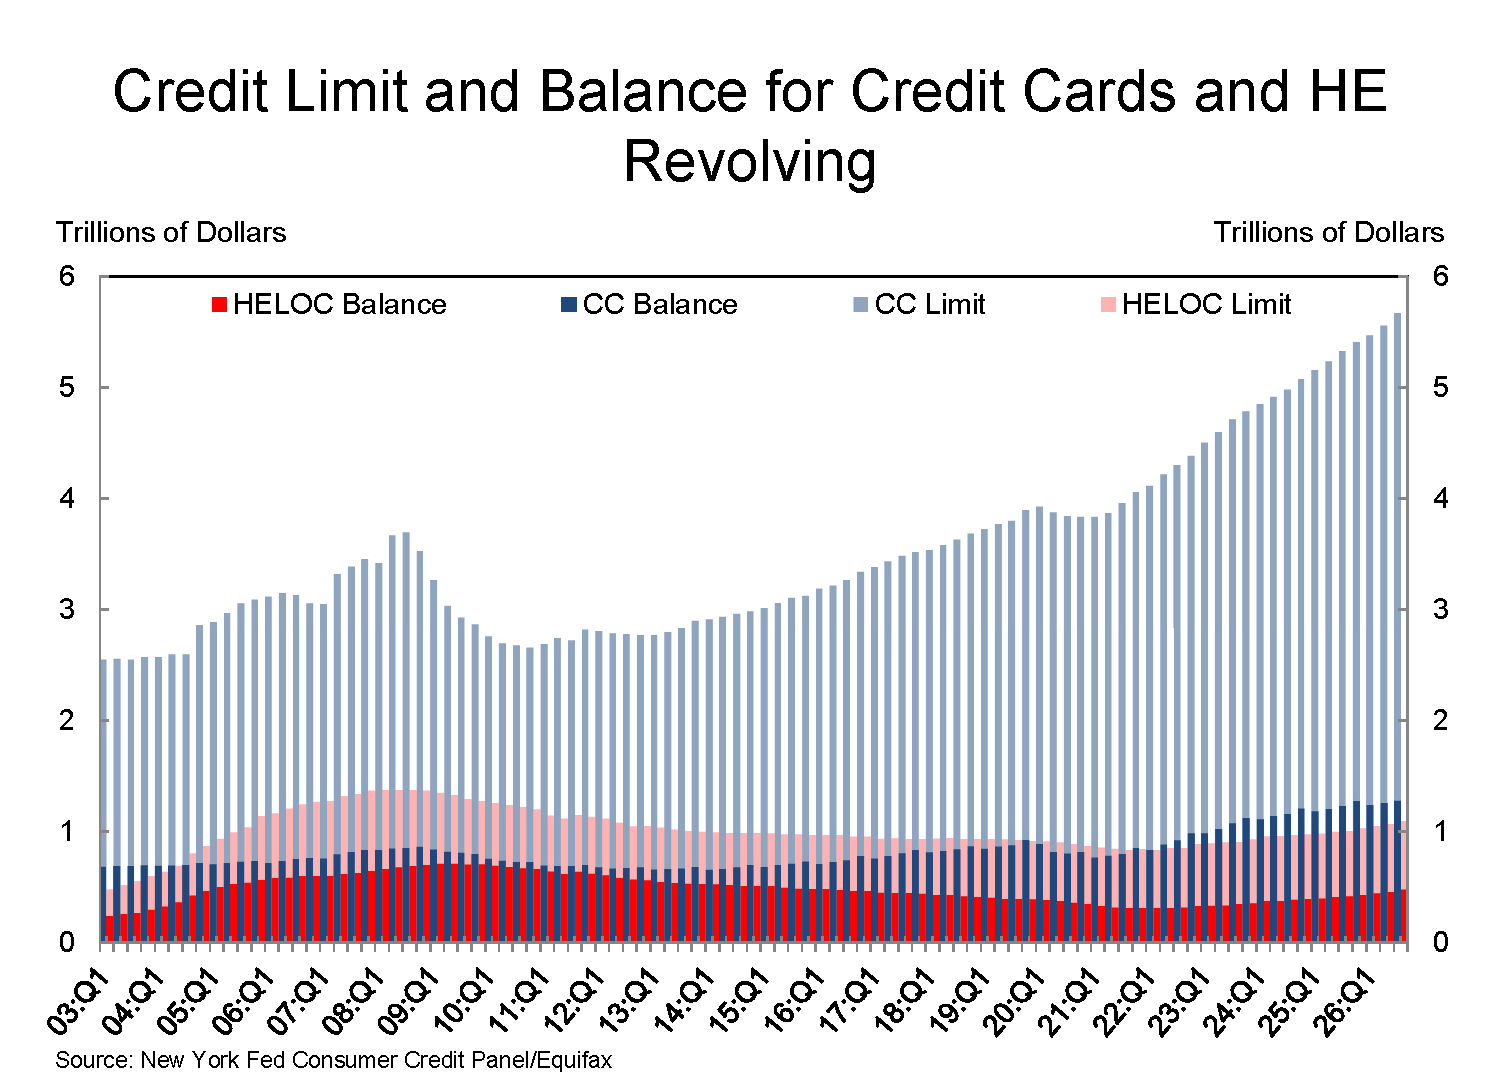
Figure 3: HELOC balances and limits fell for years after 2009 and are now rising again, while card limits and balances have climbed far above them. Source: Federal Reserve Bank of New York, Quarterly Report on Household Debt and Credit 2026 Q3, Nov 2026. Screenshot of the source report, captured 20 Nov 2026.
How much do Americans owe on home equity lines?
Close to half a trillion dollars, and the total is rising every quarter.
- HELOC balances are up 14.0% from $422 billion a year earlier (New York Fed, Nov 2026).
- Balances bottomed at $317 billion in the third quarter of 2021 and have risen 51.7% since (New York Fed, Nov 2026).
- The record was $714 billion, in the first quarter of 2009 (New York Fed, Nov 2026).
- Credit reports showed 13.35 million open home equity line accounts, a count that lists a joint account once for each borrower (New York Fed, Nov 2026).
How much line credit is open but unused?
More than half of it. Owners have drawn a little under half of the credit their lines allow.
- HELOC credit limits rose $31 billion, or 2.9%, in the third quarter of 2026, an expansion that began in 2022 (New York Fed, Nov 2026).
- Total HELOC limits reached $1.097 trillion, and $616 billion of that, 56.2%, was unused (New York Fed, Nov 2026).
Who carries HELOC balances?
Mostly people over 50. Younger owners have had less time to build equity.
- Borrowers in their 50s owe $138.8 billion on home equity lines, more than any other age group (New York Fed, Nov 2026).
- Borrowers aged 50 and over carry 68.3% of all HELOC balances, and borrowers under 30 carry $2.8 billion (New York Fed, Nov 2026).
- 6.6% of families had a HELOC in 2025, and 3.7% had one with a balance owed (Federal Reserve SCF, Oct 2026).
- 2.1% of families had a junior-lien mortgage, such as a home equity loan, up from 1.2% in 2022 (Federal Reserve SCF, Oct 2026).
How much sits on bank balance sheets?
About $300 billion in lines, and a much smaller, shrinking pile of closed-end home equity loans.
- FDIC-insured banks held $307.5 billion in home equity lines on June 30, 2026, up 6.1% from a year earlier (FDIC, Jun 2026).
- Banks held $324.5 billion in home equity lines in June 2020, so bank balances are still below where they were six years ago (FDIC, Jun 2020).
- Banks held $46.4 billion in closed-end second liens on homes, down 8.0% from $50.4 billion a year earlier (FDIC, Jun 2026).
How Many Home Equity Loans and Cash-Out Refinances Are Made?
More in 2025 than in 2024. With first-mortgage rates above 7%, owners who want cash are reaching for a second loan or a cash-out refinance instead of a straight rate cut.
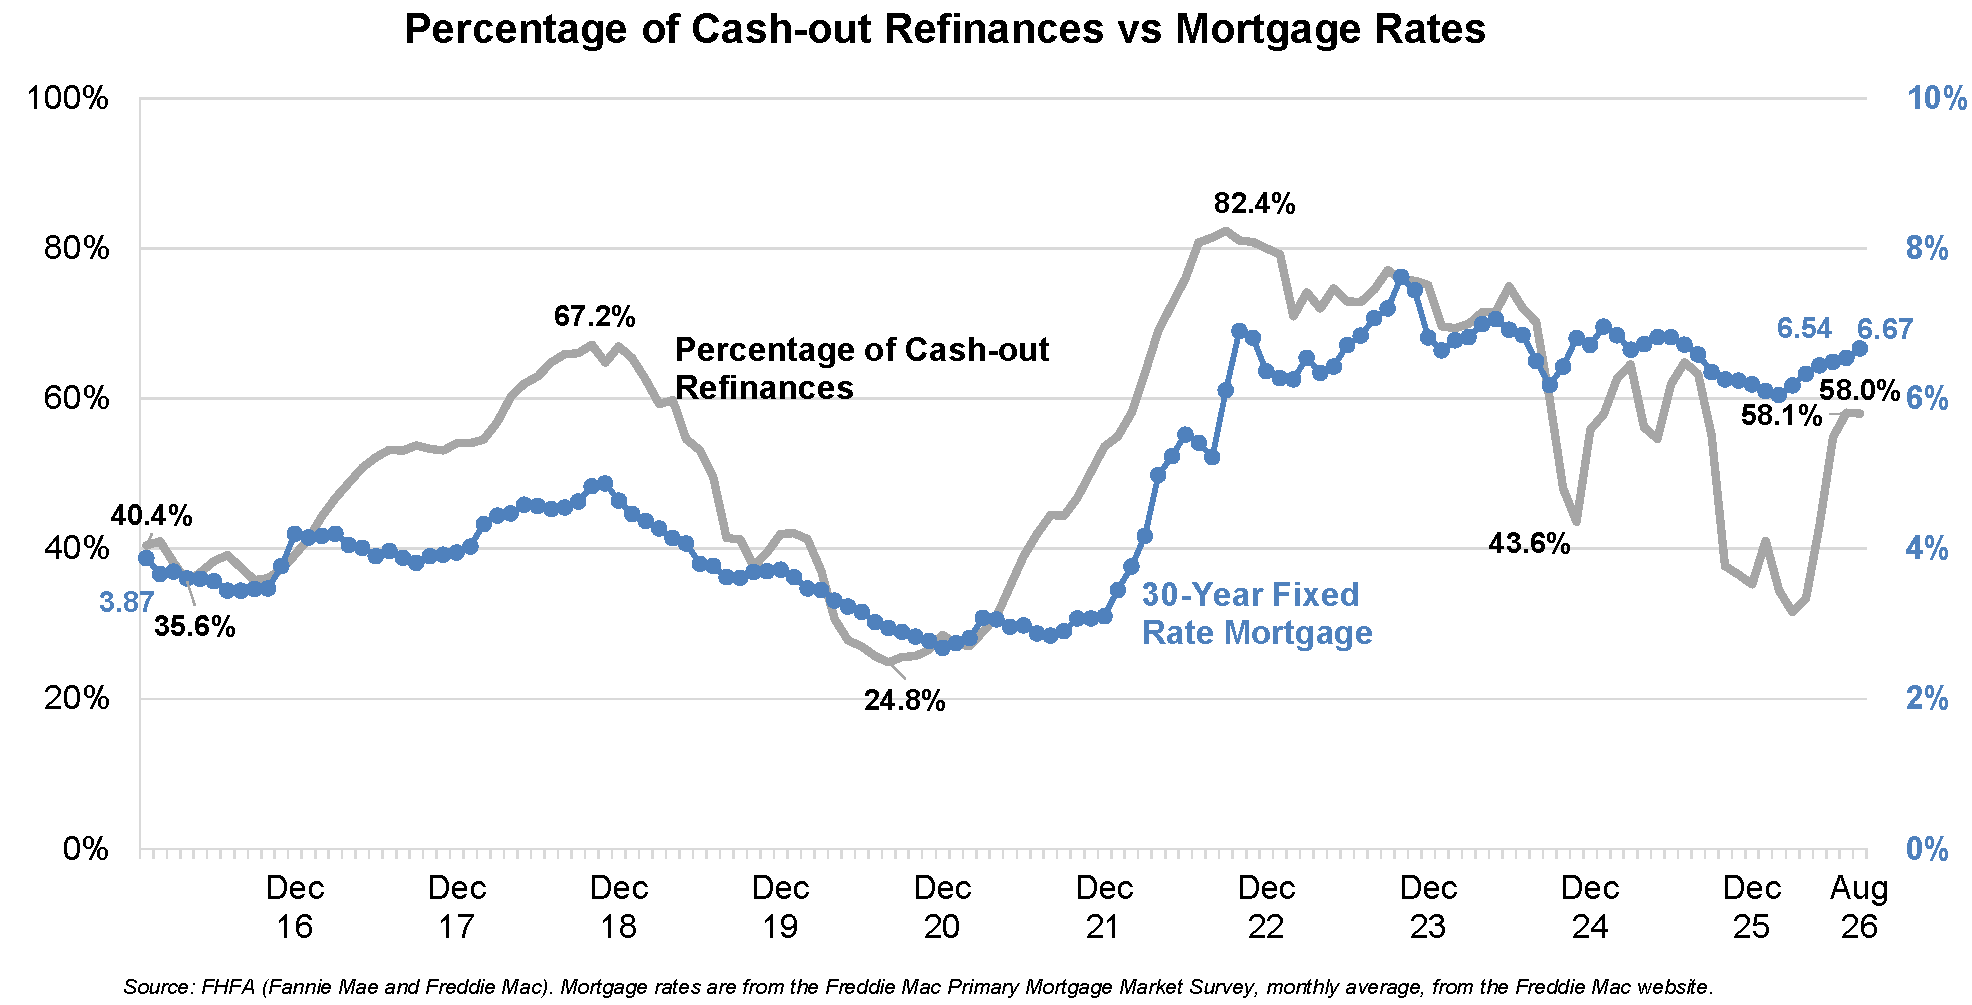
Figure 4: When rates rise, the refinances that still happen are mostly cash-out loans, which shows that owners refinance for the cash even when the rate goes up. Source: Federal Housing Finance Agency, Foreclosure Prevention and Refinance Report August 2026, Aug 2026. Chart published by the source, captured 20 Nov 2026.
How many second-lien loans are made each year?
About a million and a half, and the count grew in 2025.
- Second-lien loans reported under HMDA rose 9.2% in 2025, from 1,426,350 in 2024 (HMDA Data Browser, Mar 2025).
- Second liens made up 22.8% of all home loans reported under HMDA in 2025 (HMDA Data Browser, Mar 2026).
- The average second-lien loan or credit line was about $115,091 (HMDA Data Browser, Mar 2026).
- Lenders denied 793,247 second-lien applications in 2025, 32.0% of the applications they decided (HMDA Data Browser, Mar 2026).
How many people take cash out when they refinance?
Close to a million in 2025, borrowing more than a quarter of a million dollars each on average.
- Cash-out refinances totaled $265.9 billion in 2025 (HMDA Data Browser, Mar 2026).
- The average cash-out refinance was about $278,870 (HMDA Data Browser, Mar 2026).
- Lenders made 1,042,078 refinances without cash out in 2025 (HMDA Data Browser, Mar 2026).
- Lenders made 613,448 home improvement loans in 2025 (HMDA Data Browser, Mar 2026).
Is cash-out borrowing still growing in 2026?
Yes. Cash-out loans are holding up even as rate-cut refinances fade.
- Cash-out loans were 58.0% of Fannie Mae and Freddie Mac refinances in August 2026, against a record 82.4% in September 2022 (FHFA Refinance Report, Aug 2026).
- Fannie Mae and Freddie Mac refinanced 41,629 loans in August 2026, down from 46,974 in July (FHFA Refinance Report, Aug 2026).
- $595 billion in new mortgages appeared on credit reports in the third quarter of 2026, counting purchases and refinances (New York Fed, Nov 2026).
- Cash-out loans accounted for 1 in 7 rate locks in recent weeks, even with 30-year rates above 7% (ICE Mortgage Monitor, Nov 2026).
- Purchase loans made up roughly 80% of rate locks in early October 2026 (ICE Mortgage Monitor, Nov 2026).
- Servicers kept only 26% of their cash-out refinance borrowers in the third quarter; the rest went to another lender (ICE Mortgage Monitor, Nov 2026).
- Cash-out refinances now cause 75% of the loans servicers lose to refinancing (ICE Mortgage Monitor, Nov 2026).
Why Do People Borrow Against Their Homes?
More and more, to pay off other debt. Renovation is still the most common reason, but debt consolidation has been gaining on it every year since 2022, and the card balances next to the mortgage help explain why.
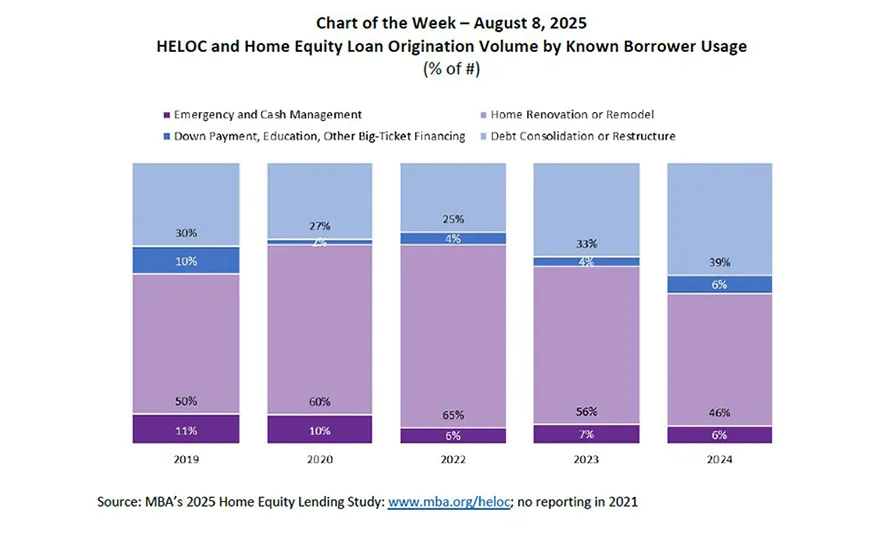
Figure 5: Debt consolidation has grown from a quarter of home equity lending in 2022 to nearly two in five loans in 2024, while renovation fell below half. Source: Mortgage Bankers Association, Chart of the Week: HELOC and Home Equity Loan Origination Volume by Known Borrower Usage, Aug 2025. Chart published by the source, captured 20 Nov 2026.
What do borrowers use home equity for?
Renovation first and debt consolidation second, with the gap closing.
- Home renovation fell to 46% of home equity loan and HELOC volume in 2024, from 65% in 2022 (MBA, Aug 2025).
- Debt consolidation was 30% of volume in 2019, before falling during the low-rate years and climbing back (MBA, Aug 2025).
- Emergency and cash management needs were 6% of volume in 2024, and down payments, education and other big purchases another 6% (MBA, Aug 2025).
- Among lenders that reported in both years, HELOC and home equity loan originations rose 7.2% in 2024, and debt outstanding grew 10.3% (MBA, Aug 2025).
How much card debt sits next to the mortgage?
A lot, and it costs far more than the mortgage does.
- Americans owe $1.29 trillion on credit cards (New York Fed, Nov 2026).
- Card balances rose $22 billion, or 1.7%, in the third quarter of 2026 (New York Fed, Nov 2026).
- 44.7% of families carried a credit card balance after their last payment in 2025 (Federal Reserve SCF, Oct 2026).
- Among families with a card balance, the median balance was $3,100, up 5% from 2022 (Federal Reserve SCF, Oct 2026).
How much other debt do households carry?
More each quarter, and the payments are taking a bigger bite of income.
- Total household debt reached $19.11 trillion, up $334 billion in the third quarter of 2026 (New York Fed, Nov 2026).
- Debt other than mortgages and home equity lines grew $55 billion in the quarter (New York Fed, Nov 2026).
- The share of families whose debt payments take more than 40% of their income rose from 6.5% to 8.6% between 2022 and 2025, the highest since 2013 (Federal Reserve SCF, Oct 2026).
If you carry cards or other loans next to a mortgage you want to keep, we build one plan around your whole picture: a fixed-rate home equity loan that moves those balances into one fixed payment and keeps your mortgage as it is. See it at goodloan.ai. Call, text or chat (866) 599-0088, 8am to 8pm Eastern.
What Does It Cost to Borrow Against a Home?
A home equity loan costs more than a first mortgage and far less than a credit card. That middle ground is what makes a second loan worth a look for owners who want to keep a low first-mortgage rate.
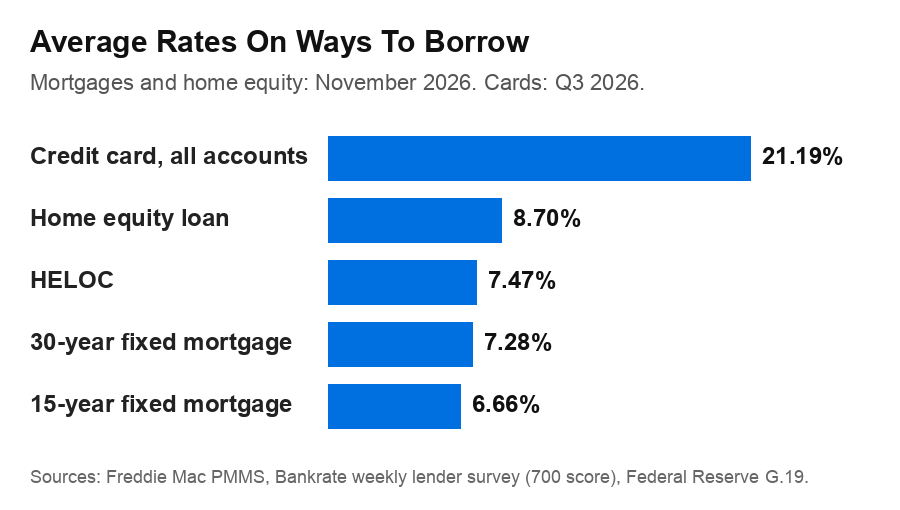
Figure 6: Card rates sit at about two and a half times the average rate on a home equity loan in the latest reading from each source. Source: Bankrate, home equity loan rates, Nov 2026, with Freddie Mac PMMS, Nov 2026, and Federal Reserve G.19, Sep 2026. Chart drawn by GoodLoan from the sources' data, 20 Nov 2026.
What are home equity loan and HELOC rates today?
In the 7% to 9% range for a borrower with a 700 credit score.
- Bankrate's weekly lender survey put the national average home equity loan rate at 8.70% as of November 18, 2026, for a borrower with a 700 credit score (Bankrate, Nov 2026).
- The same survey, which also assumes a 700 credit score, put the average HELOC rate at 7.47% (Bankrate, Nov 2026).
How do they compare with mortgage and card rates?
A home equity loan sits a little above a first mortgage and far below a card.
- The average 15-year fixed mortgage rate is 6.66%, up from 5.54% a year ago (Freddie Mac, Nov 2026).
- On card accounts that were charged interest, the average rate is 22.36% (Federal Reserve, Sep 2026).
Are banks tightening standards on home equity lines?
No. Standards and demand held steady in the latest Federal Reserve survey of banks.
- Banks reported that standards for HELOCs were basically unchanged in the third quarter of 2026, and demand for HELOCs was unchanged too (Federal Reserve SLOOS, Nov 2026).
Three things decide the total interest a household pays: the rate, how much is owed, and how many years it is owed for. We lay all three out for your own debts, with a fixed-rate home equity loan that keeps your mortgage as it is, at goodloan.ai. Call, text or chat (866) 599-0088, 8am to 8pm Eastern.
How Do Home Equity Loans Perform?
Well. Home equity lines ran into trouble after 2008, but today they fall behind less often than mortgages and far less often than credit cards.
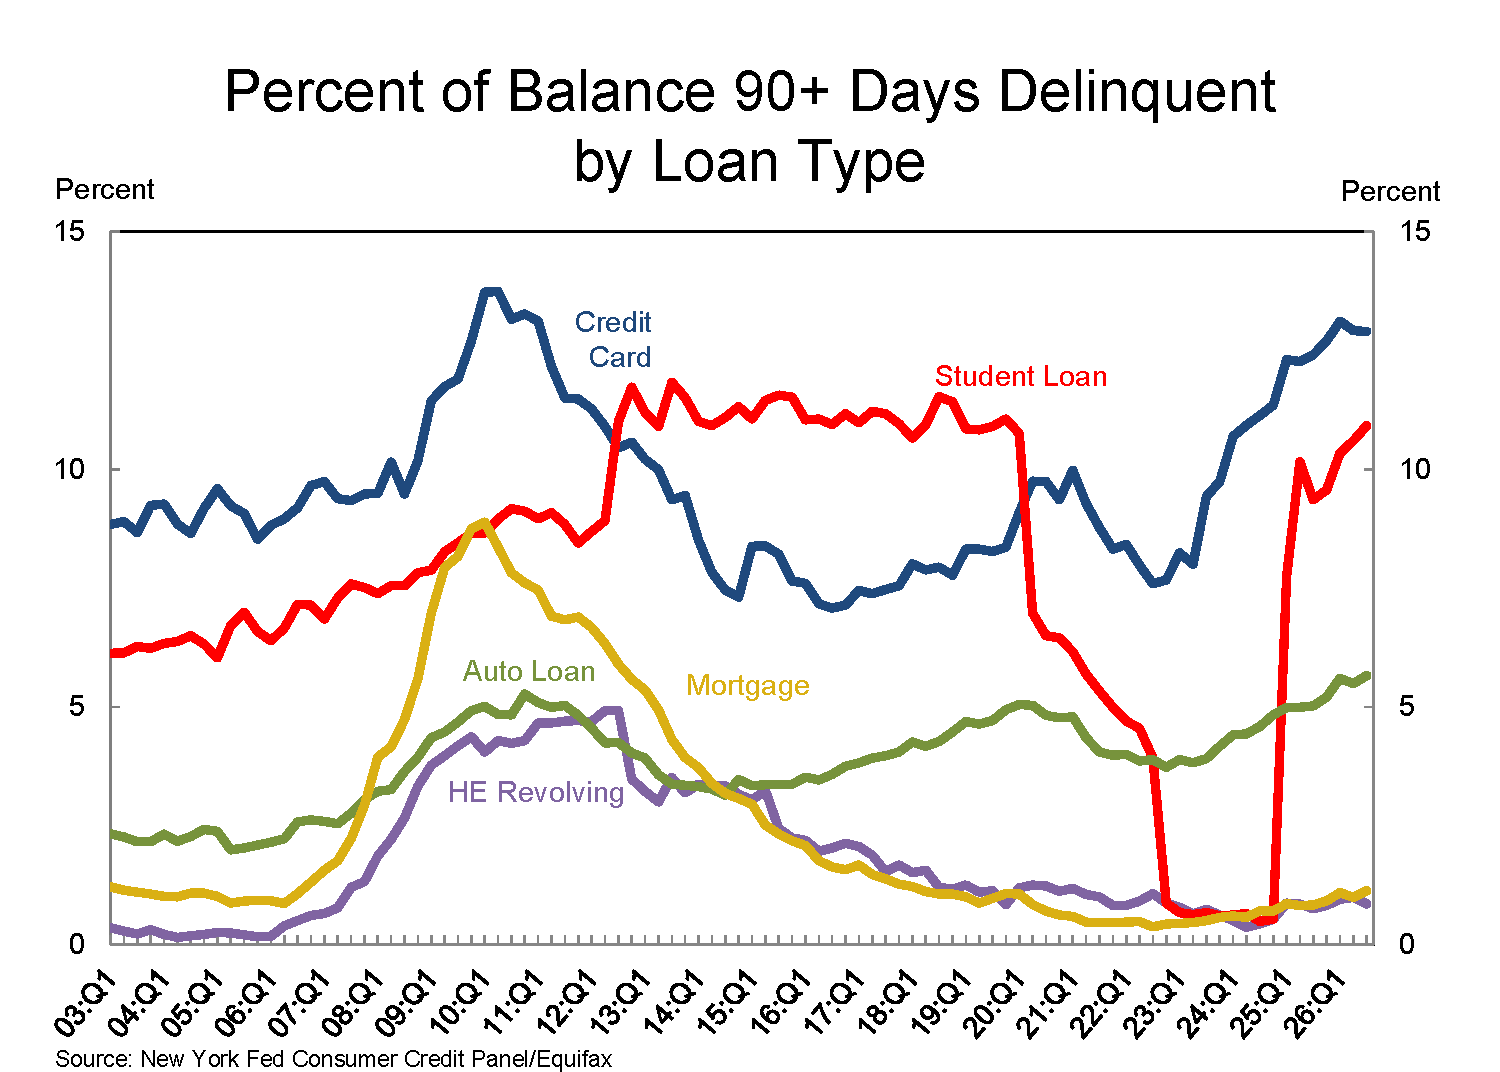
Figure 7: Serious late payments on home equity lines peaked near 5% in 2012 and have stayed under 1% in recent years, a fraction of the rate on credit cards. Source: Federal Reserve Bank of New York, Quarterly Report on Household Debt and Credit 2026 Q3, Nov 2026. Screenshot of the source report, captured 20 Nov 2026.
How often do HELOC borrowers fall behind?
Rarely. Fewer than one dollar in a hundred is seriously late.
- 1.13% of mortgage balances were 90 or more days late in the third quarter of 2026 (New York Fed, Nov 2026).
- The HELOC late rate was 0.75% a year earlier and peaked at 4.93% in the third quarter of 2012 (New York Fed, Nov 2026).
- Over the four quarters to September 2026, 1.17% of HELOC balances moved into serious delinquency, down from 1.27% a year earlier (New York Fed, Nov 2026).
How do bank home equity lines perform?
Most are current. About one and a half percent are seriously late or no longer earning interest.
- On June 30, 2026, $1.60 billion of bank home equity lines were 30 to 89 days past due, 0.52% of balances (FDIC, Jun 2026).
- Lines 90 or more days past due or on nonaccrual came to $4.63 billion, 1.51% of balances (FDIC, Jun 2026).
How do all mortgages perform?
Late payments on mortgages are edging up.
- 4.37% of all one-to-four-unit mortgages were behind on payments in the second quarter of 2026, up 44 basis points from a year earlier (MBA, Aug 2026).
- The delinquency rate on conventional loans was 2.72% (MBA, Aug 2026).
- The delinquency rate was 11.79% on FHA loans and 4.89% on VA loans (MBA, Aug 2026).
- Across all household debt, 5.0% of balances were in some stage of delinquency at the end of September 2026 (New York Fed, Nov 2026).
Who Makes Home Equity Loans?
Big regional banks and credit unions, with credit union balances growing faster than bank balances. Some of the largest banks pulled back from home equity lending after 2020 and others moved in.
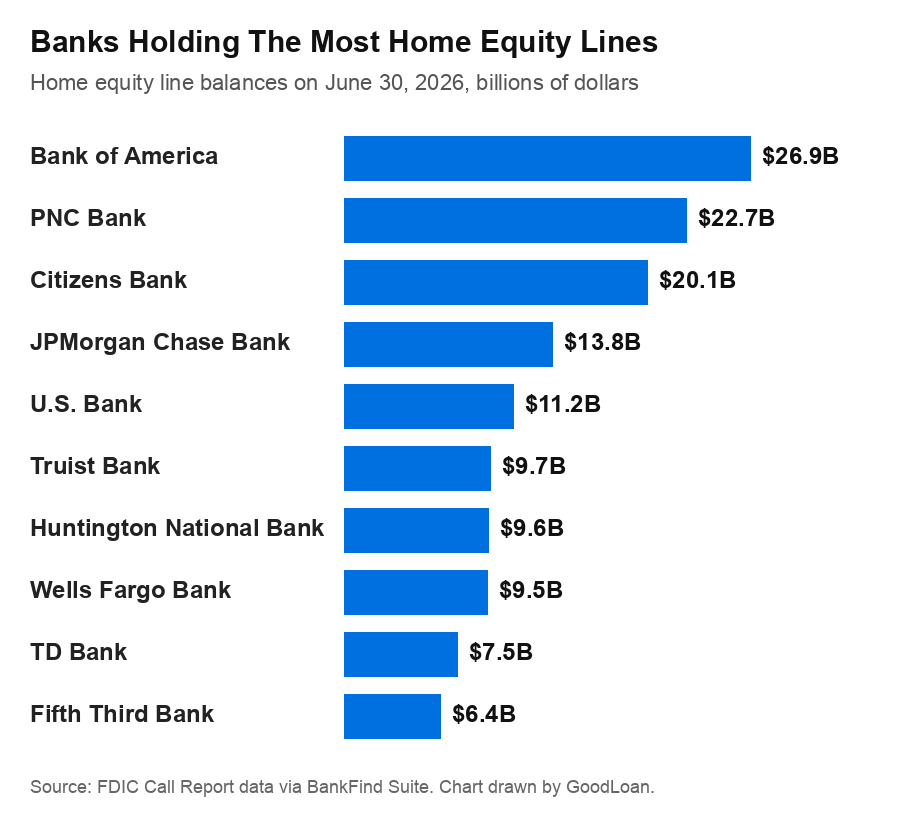
Figure 8: Three banks hold more than $20 billion each in home equity lines, and the top ten hold close to half of the bank total. Source: FDIC, Call Report data via BankFind Suite, Jun 2026. Chart drawn by GoodLoan from the source's data, 20 Nov 2026.
Which banks hold the most home equity lines?
Bank of America, PNC and Citizens, each above $20 billion.
- PNC held $22.7 billion and Citizens held $20.1 billion (FDIC, Jun 2026).
- JPMorgan Chase held $13.8 billion and U.S. Bank held $11.2 billion (FDIC, Jun 2026).
- The ten largest holders had 44.7% of all bank home equity line balances (FDIC, Jun 2026).
- 3,263 of the 4,313 FDIC-insured banks held at least some home equity lines (FDIC, Jun 2026).
Which big lenders have pulled back or moved in?
Wells Fargo shrank its lines by nearly three quarters since 2020, while PNC and Citizens grew theirs.
- Wells Fargo's home equity lines fell from $35.0 billion in June 2020 to $9.5 billion in June 2026, a 72.7% drop (FDIC, Jun 2026).
- Bank of America's lines fell from $37.1 billion in June 2020, while Citizens grew from $11.6 billion and PNC from $13.3 billion (FDIC, Jun 2026).
- U.S. Bank holds the most closed-end second liens on homes of any bank, $2.9 billion, ahead of JPMorgan Chase at $2.5 billion (FDIC, Jun 2026).
How big a role do credit unions play?
A large and fast-growing one.
- Credit unions' junior-lien home loans more than doubled from $87.0 billion in mid-2022 (NCUA, Jun 2026).
- Credit union loans secured by one-to-four-family homes rose 7.8% in the year to mid-2026, to $834.1 billion (NCUA, Jun 2026).
- 4,214 federally insured credit unions were operating in mid-2026, down 3.6% from a year earlier (NCUA, Jun 2026).
- The delinquency rate on credit union home loans and other non-commercial real estate loans was 0.83% in mid-2026 (NCUA, Jun 2026).
How many lenders report home loans?
Fewer than a year earlier.
- About 4,768 lenders filed HMDA data for 2025 (CFPB, Mar 2026).
- That was down from about 4,898 filers for 2024 (CFPB, Mar 2025).
Glossary
- Home equity: what a home is worth minus everything owed against it.
- Tappable equity: the equity an owner can borrow against while still leaving 20% of the home's value untouched.
- Home equity loan: a second loan on the home, paid out once, usually at a fixed rate with a fixed payment. The first mortgage stays as it is.
- HELOC: home equity line of credit, a second lien that works like a credit line, usually at a variable rate.
- Second lien (junior lien): a loan secured by the home that ranks behind the first mortgage.
- Cash-out refinance: a new, larger first mortgage that replaces the old one and pays the difference to the borrower.
- CLTV: combined loan-to-value ratio, all debt against a home divided by its value.
- Delinquency rate: the share of loans or balances that are behind on payments.
- Nonaccrual: a loan a bank has stopped counting interest on because it doubts it will be paid.
- Basis point: one hundredth of a percentage point.
- HMDA: the Home Mortgage Disclosure Act, which requires most lenders to report every home loan application they receive.
- Call Report: the quarterly financial report every FDIC-insured bank files.
- SLOOS: the Federal Reserve's quarterly survey of bank lending staff on lending standards and demand.
Methodology and Sources
Every statistic on this page was read on the page, file or dataset of the group that produced it, in November 2026. We do not cite statistics roundups, lender blogs or news summaries. Where we worked out a share, an average or a change ourselves, we used only the numbers in the linked source. Different sources measure different things, so their totals differ: the New York Fed counts home equity lines at every lender, the FDIC counts only banks, ICE measures equity only on homes with a mortgage, and the Federal Reserve's $35.8 trillion covers all owners. HMDA counts every second-lien loan lenders report, including purchase second loans and credit lines, and small lenders below the reporting thresholds are not in it. Rates from Bankrate's weekly survey assume a 700 credit score. This page is refreshed monthly as the Federal Reserve, the FDIC, the FHFA and the New York Fed publish new data.
Sources
- Federal Reserve Board, Financial Accounts of the United States Z.1, table S1M.b, September 11, 2026
- Federal Reserve Board, Financial Accounts of the United States Z.1, Recent Developments, September 11, 2026
- Federal Reserve Board, Changes in U.S. Family Finances from 2022 to 2025: Evidence from the Survey of Consumer Finances
- Federal Reserve Board, survey on bank lending practices (SLOOS), October 2026
- Federal Reserve Board, G.19 Consumer Credit
- Federal Reserve Bank of New York, Quarterly Report on Household Debt and Credit, 2026 Q3
- Federal Reserve Bank of New York, Quarterly Report on Household Debt and Credit, 2026 Q3 data workbook
- Federal Reserve Bank of New York, press release of November 10, 2026
- ICE, Mortgage Monitor, November 2026
- Federal Housing Finance Agency, U.S. House Price Index, October 2026 release
- Federal Housing Finance Agency, House Price Index Quarterly Report 2026Q2
- Federal Housing Finance Agency, Foreclosure Prevention and Refinance Report, August 2026
- FFIEC HMDA Data Browser API, 2025 data
- FFIEC HMDA Data Browser API, 2024 data
- Consumer Financial Protection Bureau, 2025 HMDA data on mortgage lending now available
- Consumer Financial Protection Bureau, 2024 HMDA data on mortgage lending now available
- FDIC, BankFind Suite Call Report financial data
- National Credit Union Administration, Quarterly Credit Union Data Summary 2026 Q2
- Mortgage Bankers Association, Chart of the Week: HELOC and Home Equity Loan Origination Volume by Known Borrower Usage
- Mortgage Bankers Association, National Delinquency Survey, second quarter 2026
- Freddie Mac, Primary Mortgage Market Survey
- Bankrate, home equity loan rates
- Bankrate, HELOC rates


